

The U.S. industrial real estate market had a strong first quarter, buoyed by post-election sentiment before macroeconomic uncertainty emerged at quarter end. Positive momentum was reflected in key performance metrics: new leasing activity surged, net absorption soared to its highest level since the fourth quarter of 2023, and the development pipeline fell below 300 MSF for the first time since 2019. Although concerns about trade policies persist, structural demand tailwinds and evolving supply chain dynamics continue to solidify long-term conviction in the industrial sector.
Economic Conditions & Demand Drivers
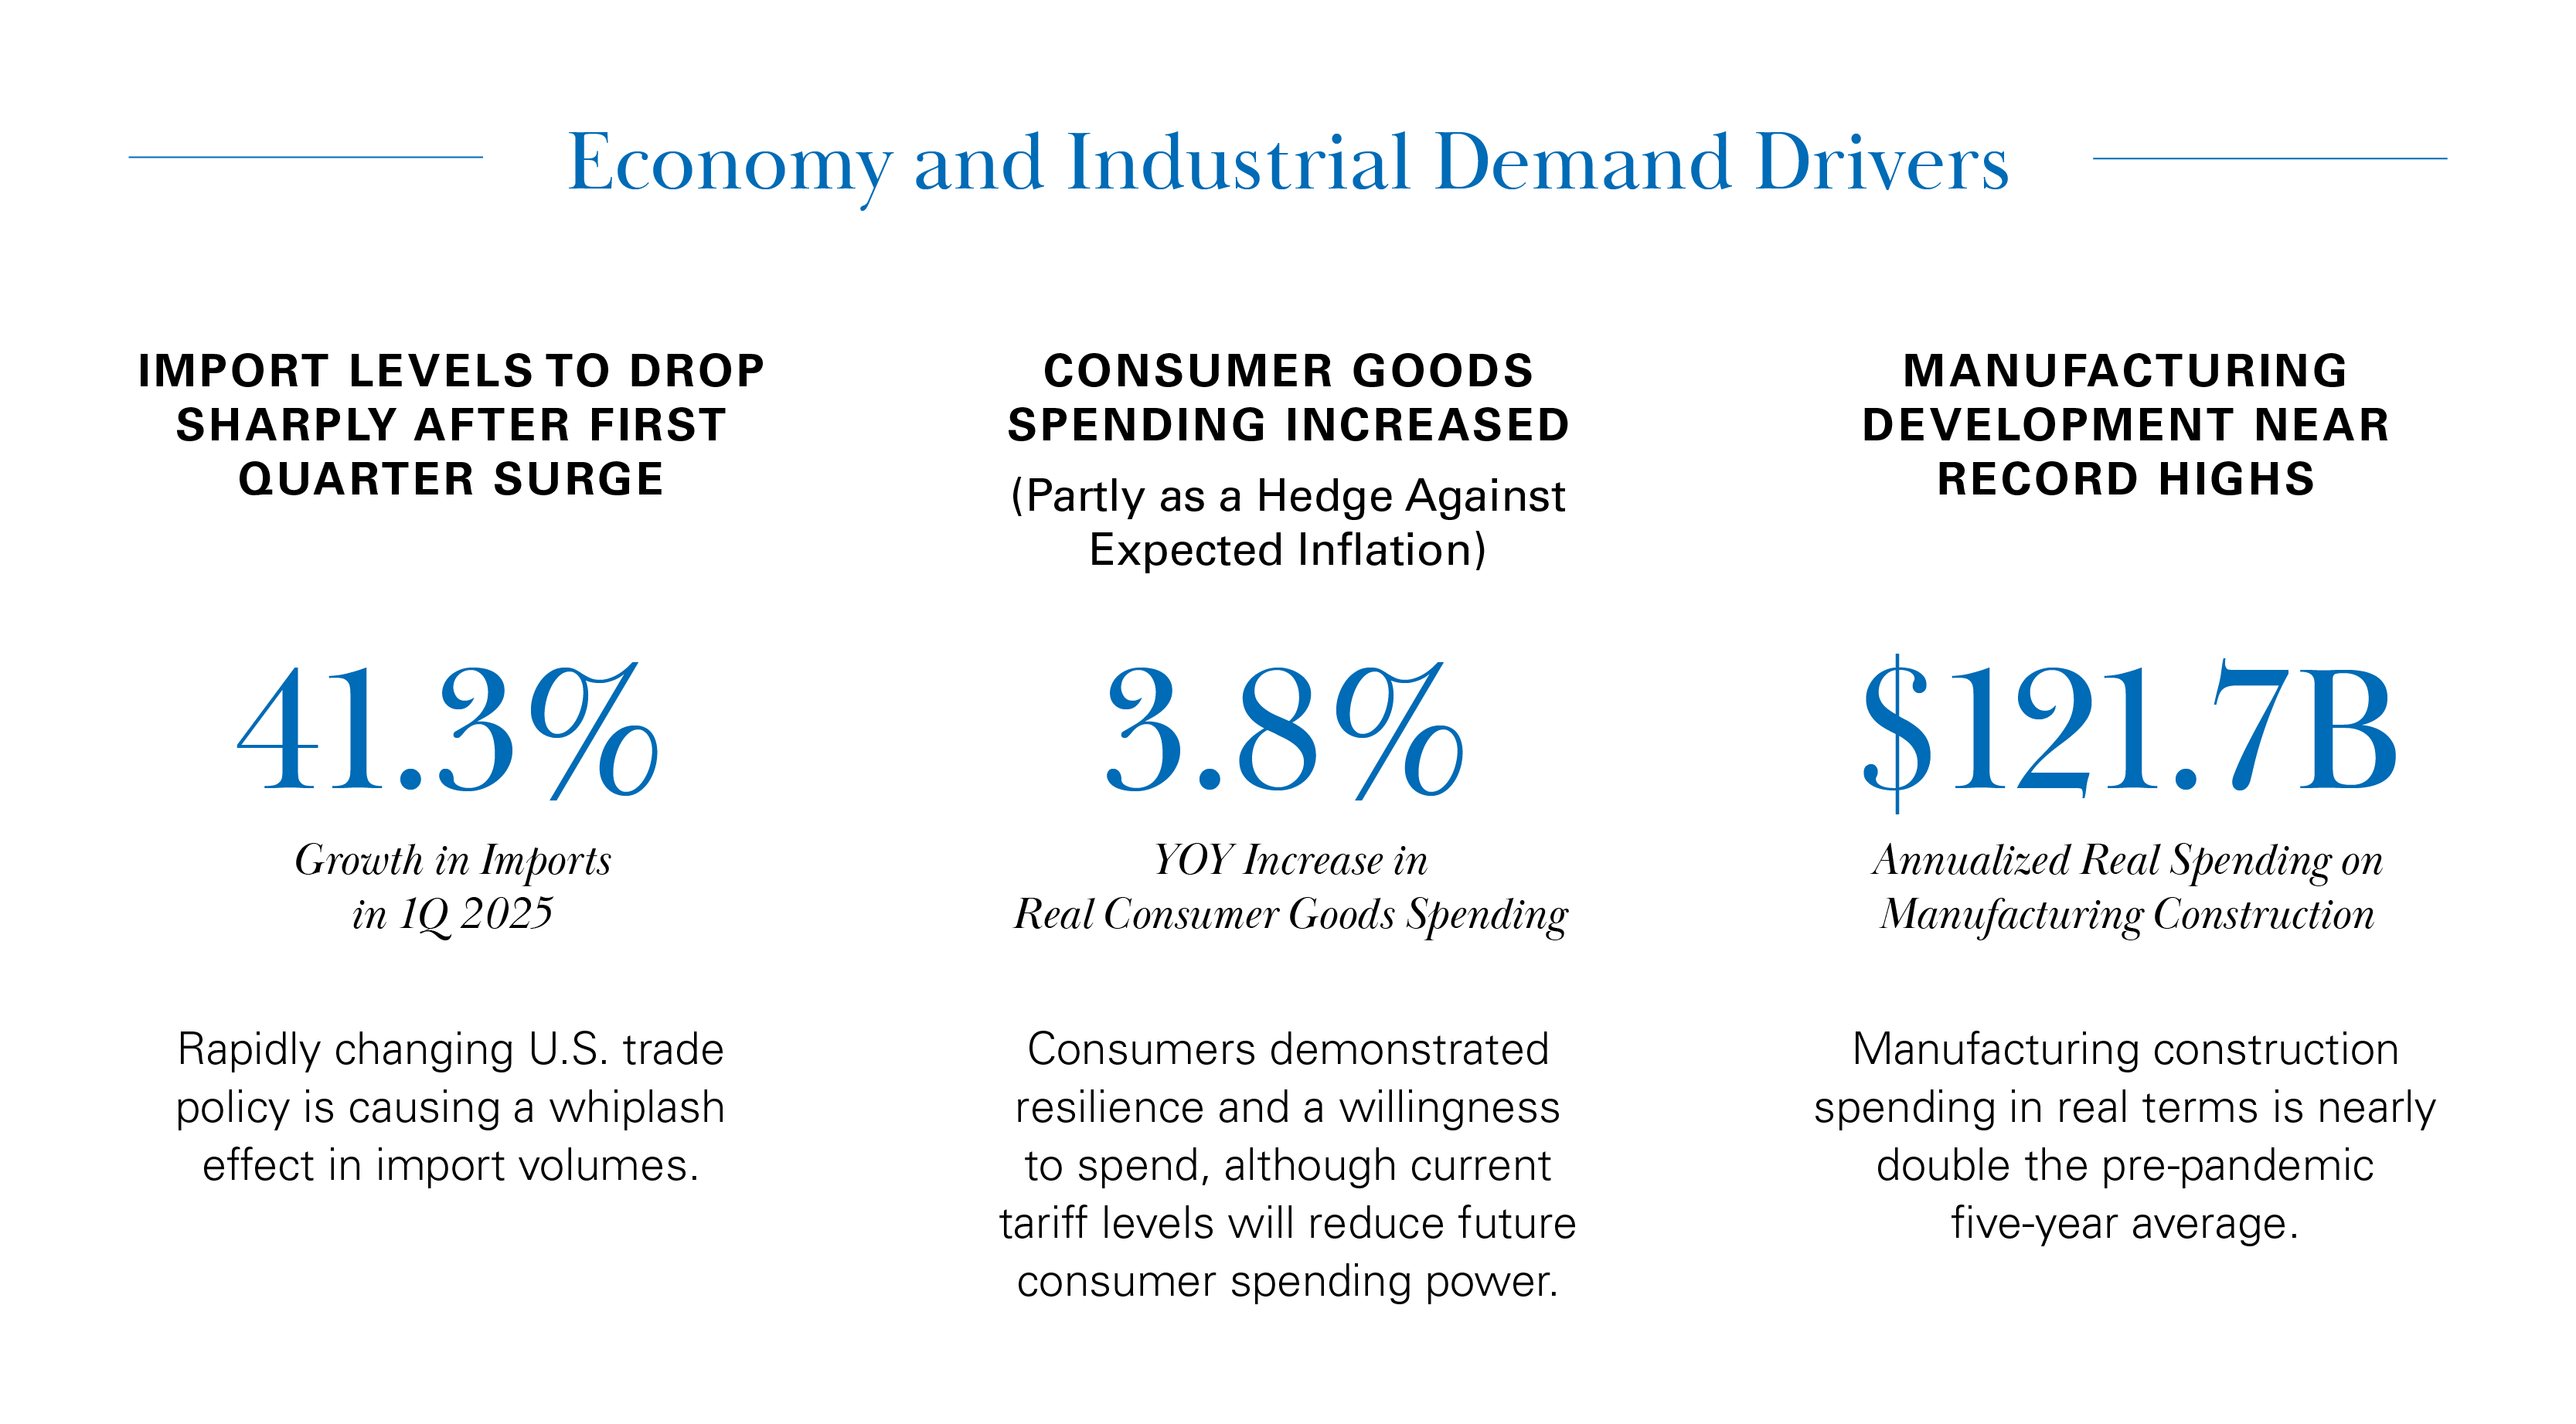
- Economic data presents a mixed outlook. Consumer confidence surveys are at the lowest levels since May 2020, business indicators are pessimistic, yet the job market remains mostly sound and some factory activity gauges are strong.
- As of May 20, the average effective U.S. tariff rate is at its highest level in a century. This impacts business models and consumption yet is a relatively small share in the totality of costs for logistics operators and consumers.
- Manufacturing construction spending continues at near record highs, reaching an inflation-adjusted $121.7 billion in February 2025, which is nearly double the pre-pandemic 5-year average. The South captures the majority of this investment.
Capital Markets
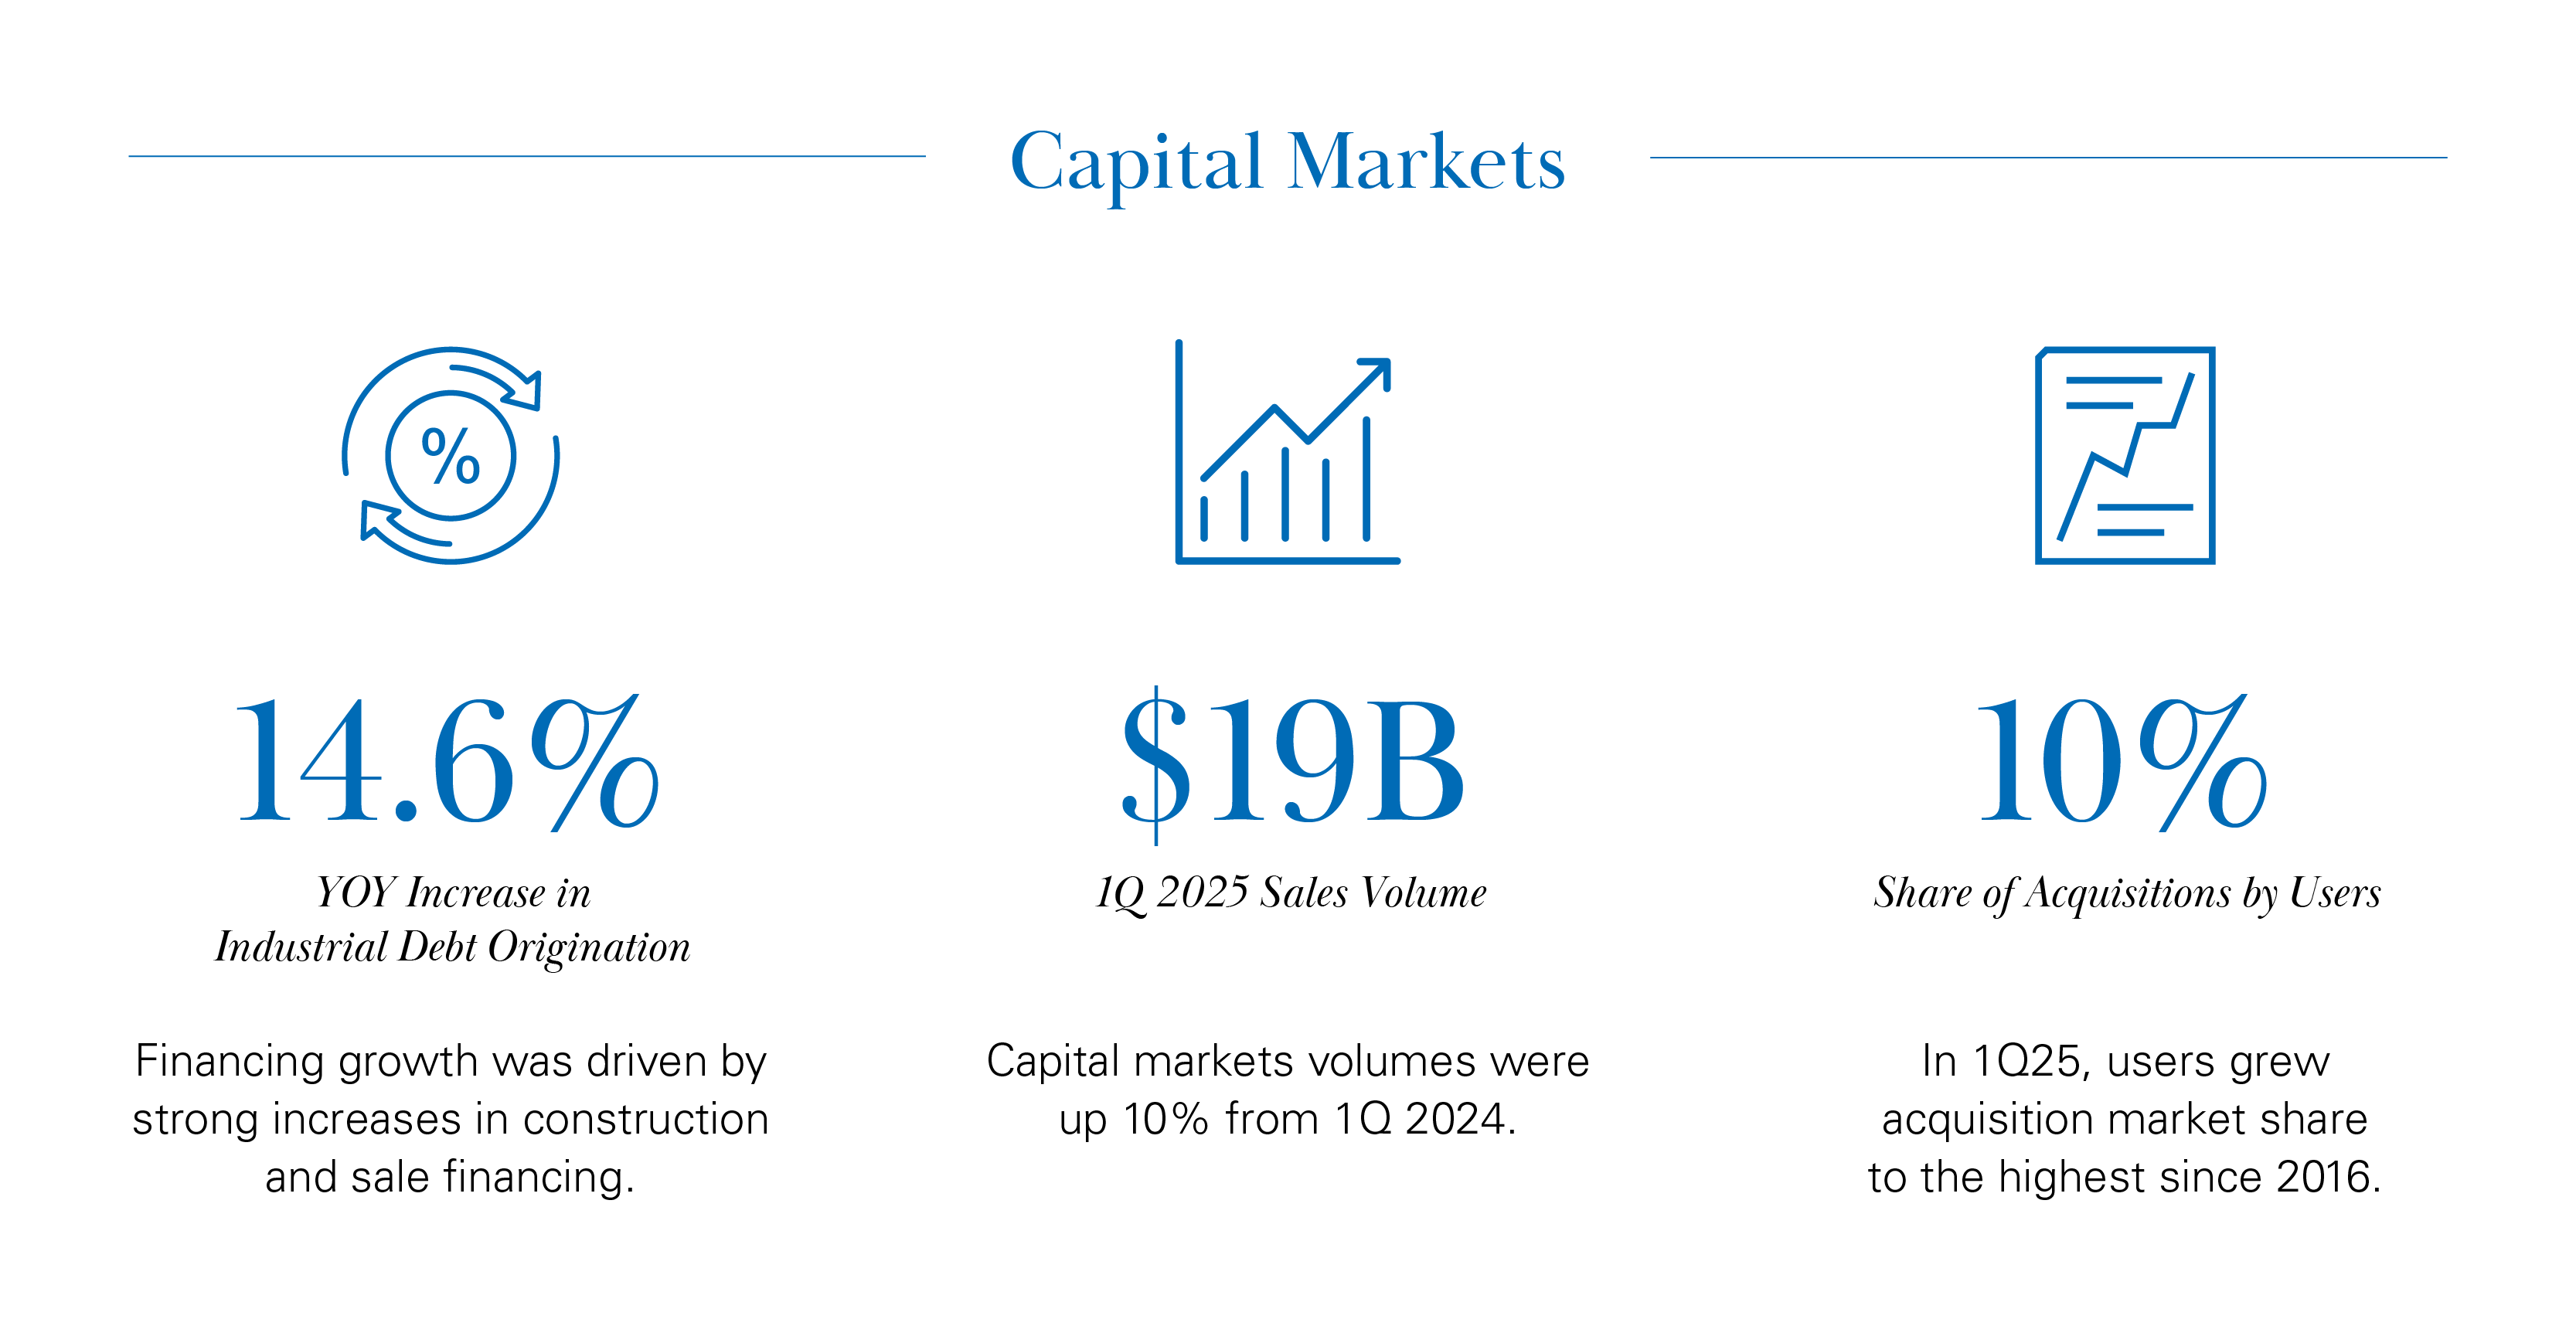
- The first quarter of 2025 ushered in $19 billion in sales volume, 10% above first-quarter 2024 volumes. Tier 2 markets such as Miami, Houston, and Phoenix have seen increased activity, while Tier 1 markets experienced a pullback.
- Industrial cap rates have fluctuated over the past 12 months in the 5% range, which will likely be the case throughout 2025. Following tariff announcements in April, REIT-implied cap rates expanded to 6.0%.
- Across the ecosystem of investor profiles, private capital continues to account for nearly half of total acquisitions. Users have boosted their acquisition share substantially during the last few years but have been net-disposers in the last two quarters. Sale leaseback sales volume grew to a 2-year high in 1Q25 as firms seek infusion of capital to pay down existing debt or, reinvest into the business.
Leasing Market Fundamentals
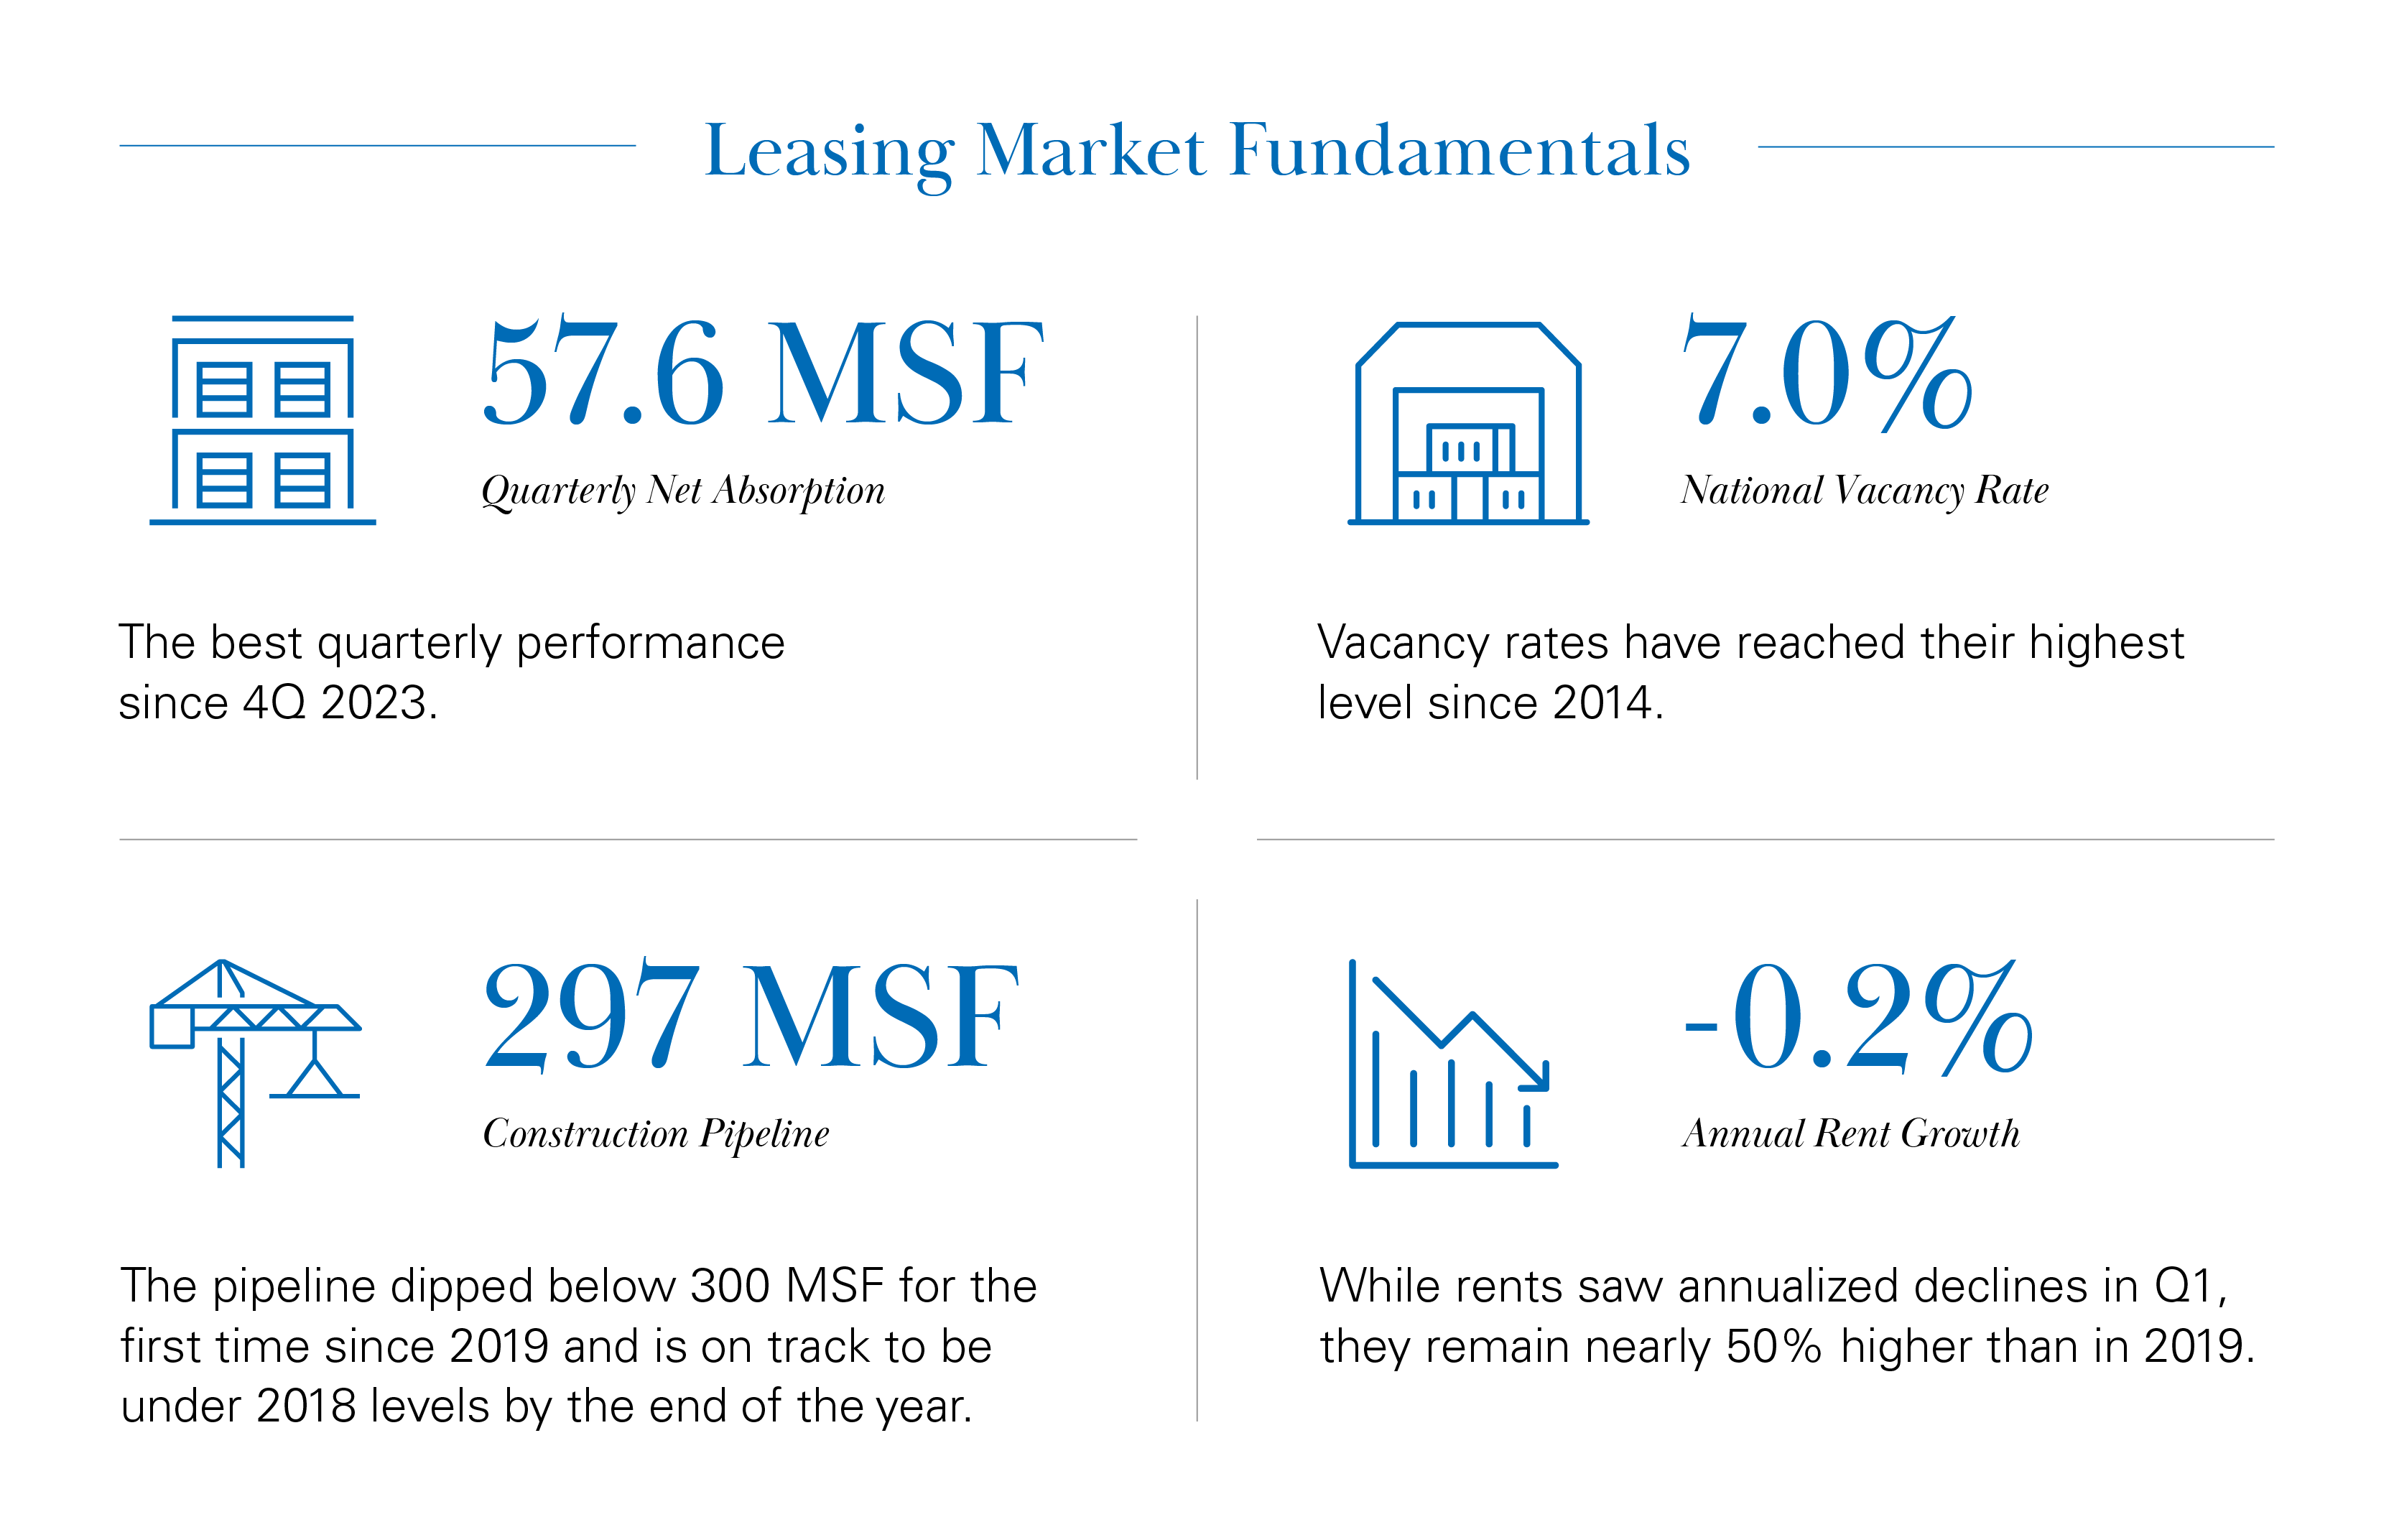
- U.S. net absorption and new leasing activity both accelerated in the first quarter of 2025, with net absorption the strongest since Q4 2023. This momentum indicated occupier positivity in the post-election window and prior to the enactment of tariff policies and associated injection of uncertainty into the market.
- Overall market vacancy rose from 6.9% to 7.0% quarter-over-quarter, reaching its highest level in more than a decade. Vacancy is highest in newly-delivered product but is coming down swiftly year-over-year. Conversely, older-vintage properties are experiencing modest increases in vacancy rates.
- Average asking rents have declined less than 1% from the peak in mid-2024, while remaining nearly 50% higher than at the end of 2019. Contract rents have reset approximately 7% from their mid-2023 peak.
Outlook
- Predicting peak vacancy is a challenge this year due to a wave of macro uncertainty. Depending on how net absorption plays out, vacancy could range from 7.0% to 7.5% by year-end.
- Tighter labor and higher input costs along with more subdued occupier demand could result in further downward pressure on new starts. This could help balance a potential demand shortfall.
- Turbulence should be anticipated this year, particularly in the second half following in the wake of the pre-tariff inventory build and higher consumer spending. If trade deals are made and certainty brought to market, there could be a snap-back in goods moving through the supply chain, capital investment, and industrial leasing activity.


